Friday, November 14, 2014

Dynamics of dune development: The effect of plants on sand deposition


Most researchers have left the Zandmotor and are busy analysing their data by now. Some people might wonder that there is still some evidence of our activities present at the Zandmotor. Especially near the ARGUS tower there are still some vegetation plots in place. Wageningen university aims study the processes that underlie dune formation and changes in dune morphology. The focus is on the relationship between sand transport, sand deposition and plant density of two different plant species: Ammophila arenaria and Elytrigia juncea of high and low density. 12 Plots of vegetation with different species composition and density were created, in which sand trapping efficiency and sand transport measurements are performed. Sand deposition within the plots is calculated using erosion pins as well as behind the plots using photogrammetry. In addition, 6 sand traps are placed in front the plots and 12 sand traps are placed behind the plots in order to trap the sand that is transported. The amount sand that is trapped is collected and afterwards is calculated. (Master thesis research from Angela Anastasiou, student of Wageningen University )
Vegetation plots in the wind
 

Tuesday, October 21, 2014

Zandmotor is under attack !

Today we are experiencing the most intense conditions so far during our MEGAPEX campaign. The cliff at the tip of the zandmotor is eroding due to the large waves.


Thursday, October 16, 2014

Surfzone dye and drones

Waves, wind and tides all influence the water motion near the beach. Although we know a lot about what drives coastal currents, we can still be amazed by how complex the flow can be in a real life situation.

This week we did experiments with green dye (don't worry, it's environmental friendly!) to get a top view of the flow pattern. The green dye is released in small patches, which is then transported and mixed by the flow.

To follow the dye movement we use small drones (UAVs) to take aerial pictures. We have to specialists at the experiment right now that can make great pictures of the beach as their drones fly about 100 m above the Sand Engine and are equipped with small GoPro Camera's. 

A few snapshots of one dye deployment are shown below:

Two small patches of dye at the start of the experiment. One offshore of the bar, and one inshore of the bar. 
after 6 minutes
after 12 minutes
After 18 minutes
And after 28 minutes
These pictured give an impression on how fluid can mix material floating in the water (swimmers, sand, oil etc.) and redistribute this matter along the coast. 

Images from Ronald Brouwer (Delft University of Technology) and Patrick Rynne (University of Miami/Waterlust)

NB.. Note the small white line in the offshore region. That's probably the edge of the fresh water from the river and the salt sea water. Pretty cool!

Tuesday, October 14, 2014

Tilt Current Meters, take 2

In an earlier blog, the Tilt Current Meters were introduced as an innovative way of measuring currents in an extensive spatial grid. Deployment and recovery of the first batch of TCM's from a RIB boat with assistance by Shore Monitoring & Research went successfully. Since as many TCM's as possible were placed in the vicinity of ADCP stations, a valuable validation dataset has been obtained to check upon the TCM's working principle. A very promising validation plot is appended below:

5-minute averaged tilt magnitude of the TCM is shown in blue, 1 hour averaged velocity magnitude of the ADCP is shown in red. There is a dominant tidal signal visible in the data.

Yesterday the TCM's have been deployed for the second time, in a slightly different array. We hope to capture some more aspects of the tidal currents on the northern flank of the Sand Motor, as recent drifter deployments showed hints of tidal eddy formation in that region.


This week, all available resources are used to study the currents around the Sand Motor. The TCM's have been deployed, the two cross-shore and one alongshore measurement arrays are still in place, drifter deployments will be carried out and the drone teams from Delft and Miami will capture dye injections from above. Exciting data guaranteed!


Sunday, October 12, 2014

Aeolian transport update - nailing it !!

Last week we were very pleased by the strong winds. Sediment was racing over the sand surface leading to some interesting measurements.
 

Underneath is an example of one of our nail experiments. We are using nails in the sand bed to measure erosion of sediment from the beach surface at short timescales. A surprising amount of sediment seems to be eroding from the intertidal zone at low tide. That was somewhat unfortunate for us since we 'want' to do these experiments with the nails at every low tide now (including the night low tides !!).


We are catching up some sleep now since the wind has been a bit less the last couple of days. BUT, we are preparing for next week where winds seem to pick up again. Ready to nail the beach again !!

Tuesday, October 7, 2014

Using sonars, a laser and a camera to observe change in RIPPLES!


As a part of the larger TUDelft hydrodynamic array, the University of New Hampshire (United States) is working to measure the temporal variability in the small scale roughness patterns (i.e. ripples) at the tip of the Sand Engine. With the dynamic nature of the Sand Engine, we are working to provide insight into the forcing mechanisms of rapid small scale bathymetric change.

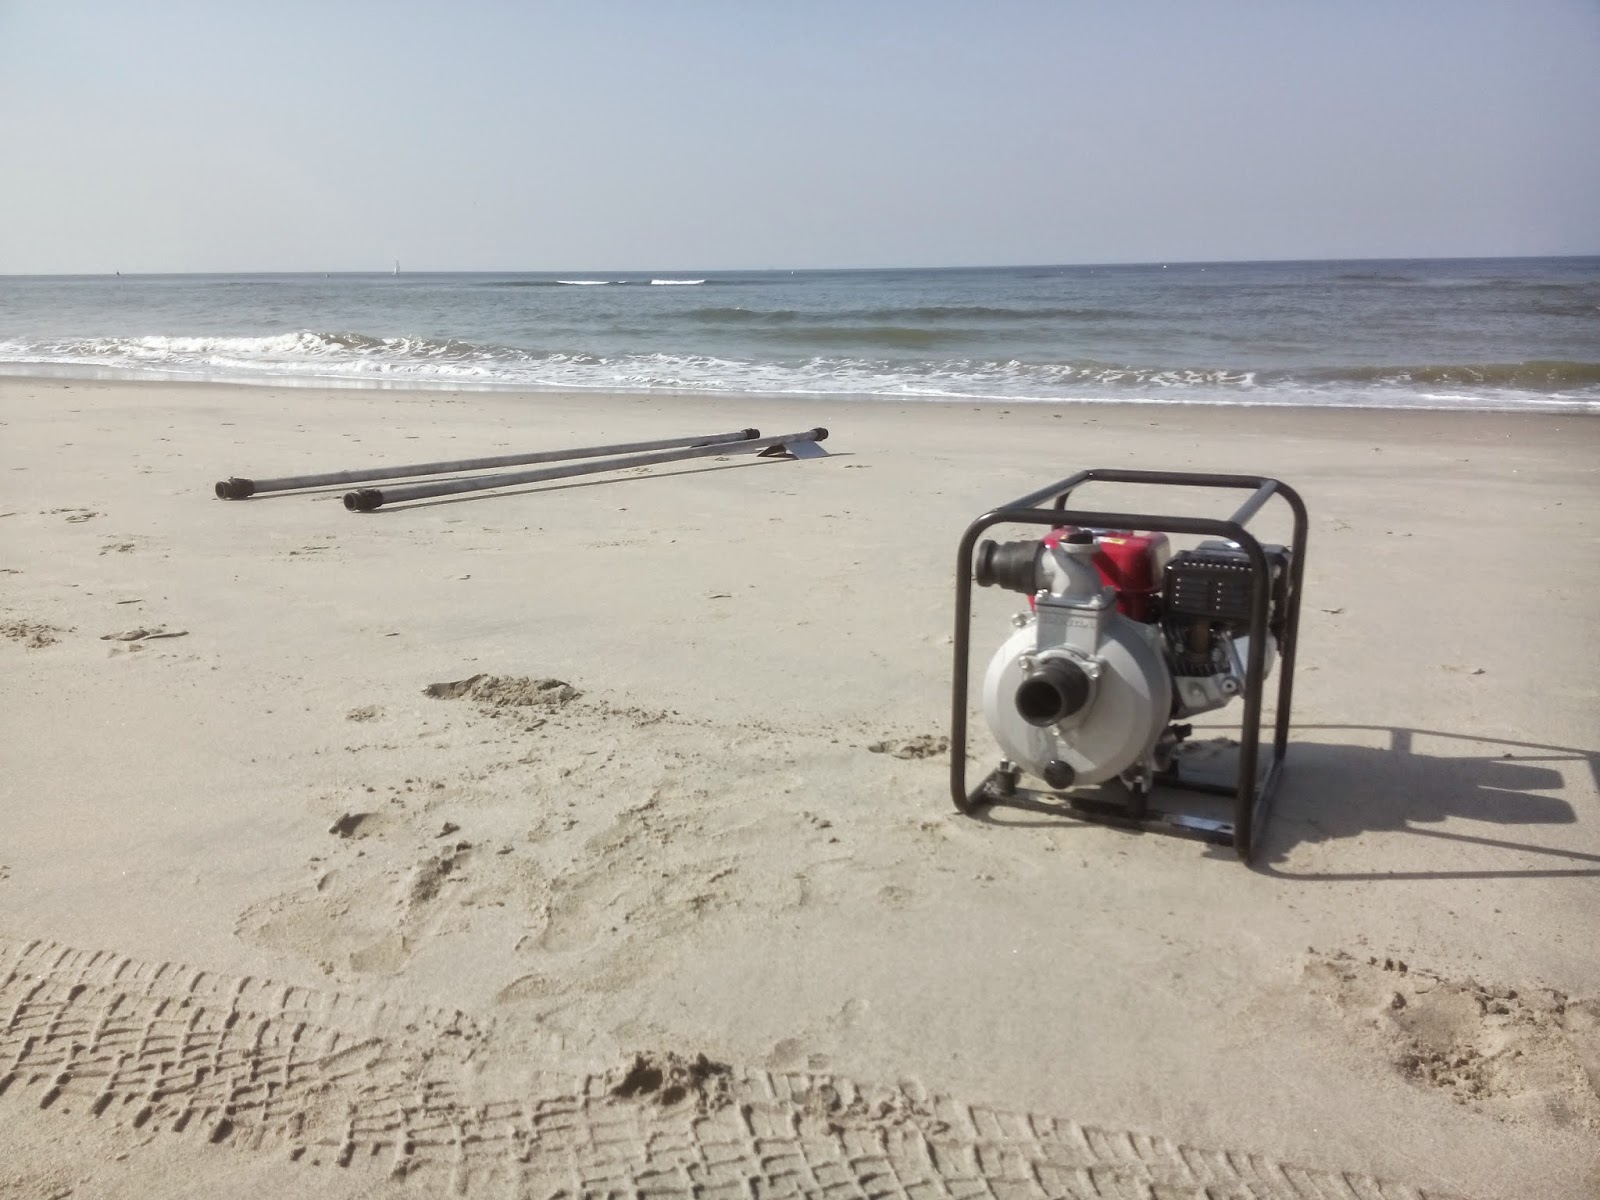
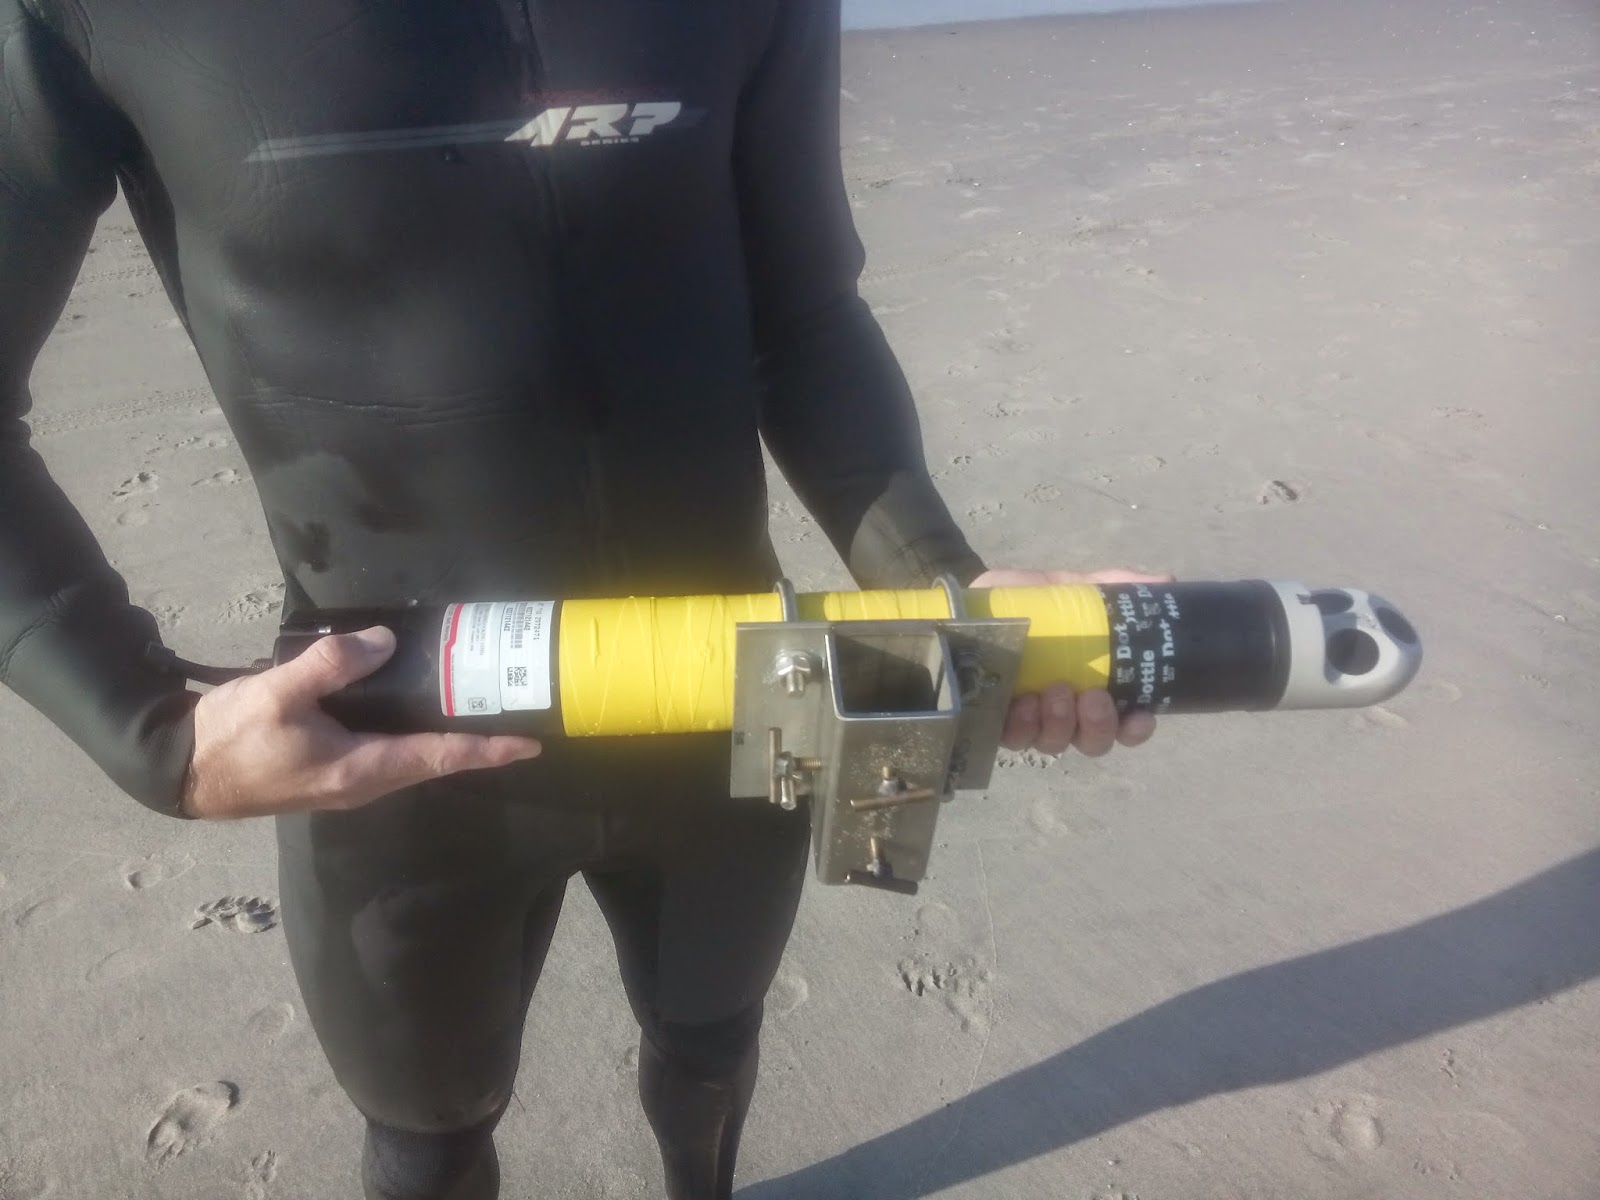
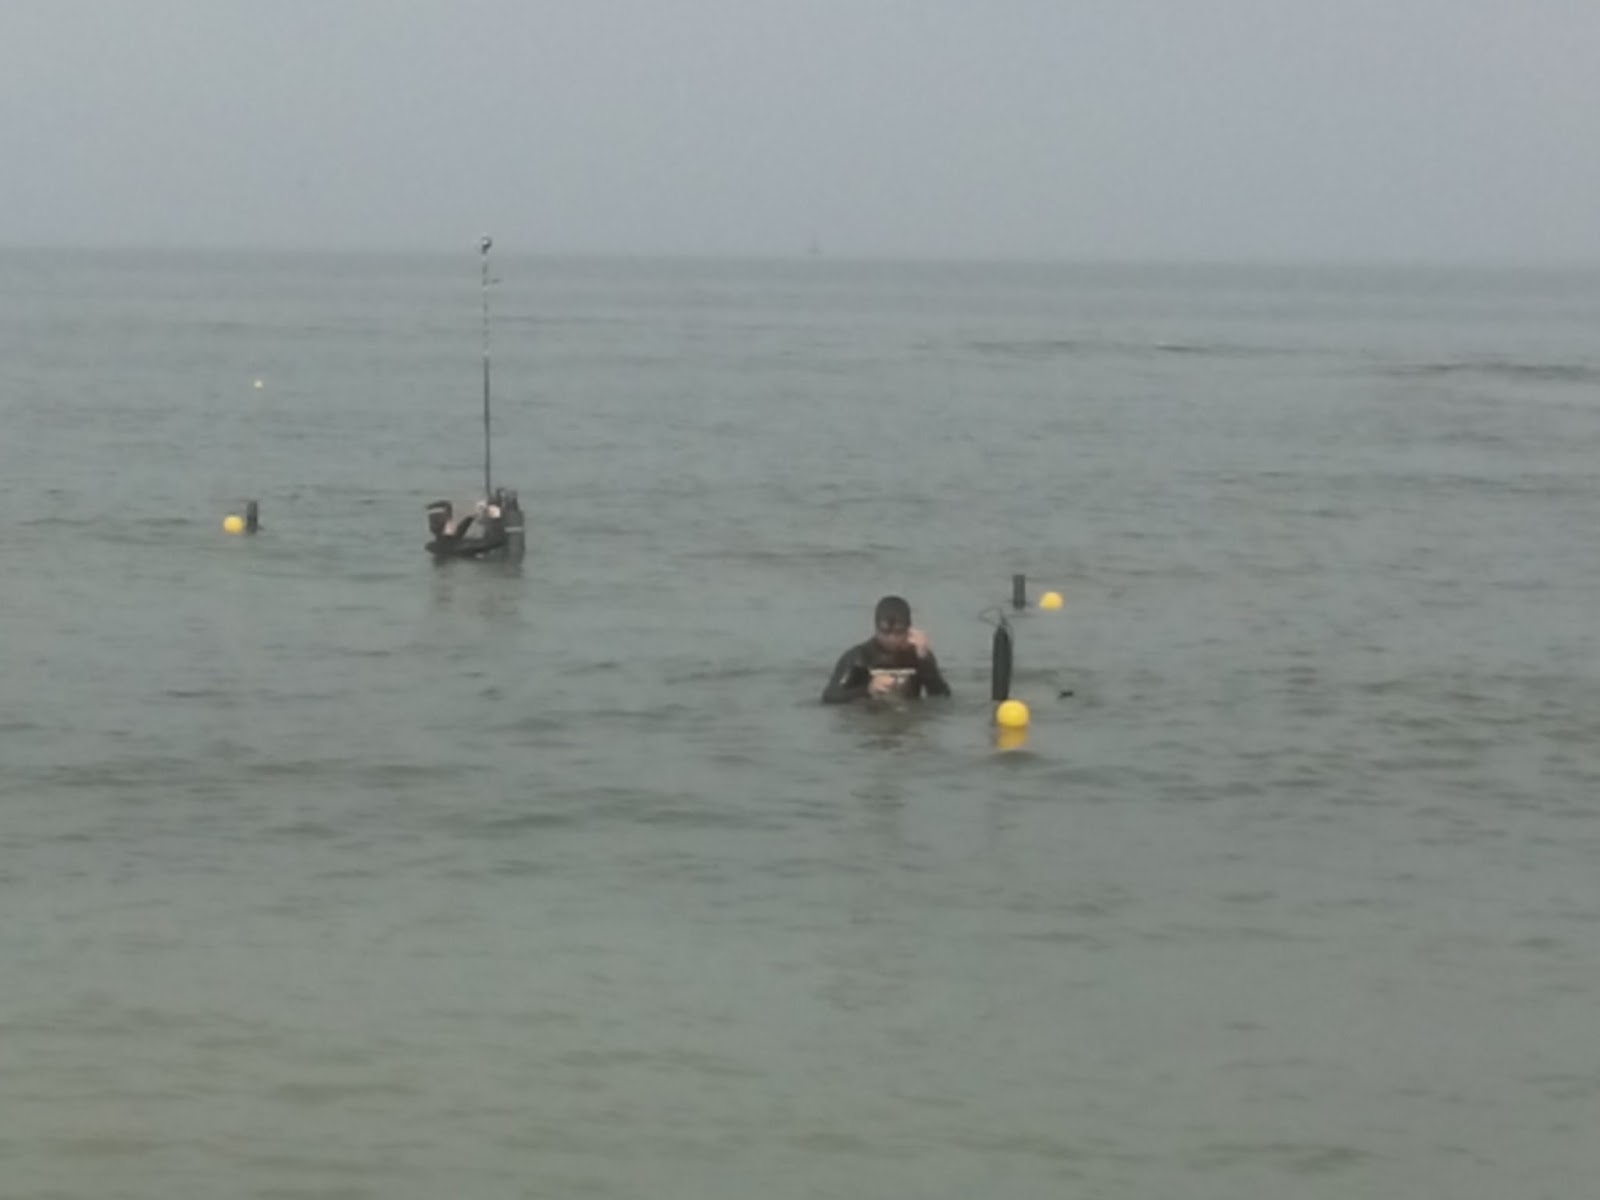
To quantitatively measure the ripple change, we have two rotary pencil beam sonars with centimeter scale resolution, and to complement these acoustic sonar measurements, we have developed a laser grid and camera system to optically measure millimeter scale change in roughness. While, the sonar works very well in any level of water column turbidity, it has inaccuracies in resolution when the ripples get very small. At the same time, the optical measurements of the camera do not work well in very turbid water, but when bedforms are very small (generally corresponding to smaller wave forcing conditions and lower turbidity), the laster-camera system can make detailed observations. These complementary tools provide us with information about small scale morphologic change. Additionally, we are using a set of acoustic velocimeters and current profilers to attribute hydrodynamic forcing conditions to observed morphologic change.

The first image below is from a sector scan of the pencil beam sonar, the color scale is of the intensity of signal return, where red indicates a high reflector (i.e. the sediment bed). At sweep distance of 0 m and Z distance of 0 m is the center of the sonar head. The sonar rotates by means of an azimuth drive in a circle to create a local 2D bathymetric map. This image was collected on October 6th, and clearly demonstrates the presence of peaky ripples.
And, the following image is an example of the laser grid projected over a flat bed and a fish. In the presence of ripples, the grid bends over the ripple crests and through the ripple troughs (like it bends over the fish) so that ripple height, length, and direction can be determined.


So far, at the Sand Engine, we have observed a very dynamic temporal variability in small scale roughness that, at first look, changes with the wave conditions. In the next few days we are looking forward to some big waves and wind, so we can see how these ripples change as the waves get larger!!


We are very excited to be here in the Netherlands for the MegaPEX experiment! A great deal of thanks goes to the PADI Foundation for funding our investigation!


Friday, October 3, 2014

Mapping the seabed of the Sand Motor with a Sidescan Sonar and Multibeam echosounder

A combined side scan sonar and multibeam device was deployed at the Sand Motor by Delft University and Deltares technicians on monday 29th and tuesday 30th of September. The aim of the device is to investigate (1) the bed forms and (2) spatial variability in bed sediment composition. Both alongshore and cross-shore transects were sailed. Basically a high-detail map of the bed at the Sand Motor was created. The area considered extended in alongshore direction from the southern side of the Sand Motor (Monster) up till Kijkduin (The Hague). It is expected that a combination of multibeam data, backscatter from the sonar and physical sediment samples will provide a wealth of information to researchers within the NEMO and NatureCoast projects.

A good working environment

Reading about all the research on the MegaPex blog you might get the impression that the beach is swarming with researchers. Mind you, only half of the experiments that are going on have been mentioned so far. Indeed, chances are high you will stumble over some sort of measurement tool when you walk along the waterline. Nonetheless, almost every morning when I’m walking up to my artificial worm beds I’m astonished by the peaceful and quiet surroundings of my working environment. It is a great place for an ecologist to work.


I start my journey at the beach clubs, then cross the lagoon channel and follow the lagoon towards the centre of the Sand Motor before crossing over to the sea side. On my way I cross several different coastal environments. First the old dunes where I regularly see rabbits, hedgehogs and foxes. Then onto a bare landscape dominated by tidal currents. Along the lagoon I see many benthic creatures, numerous small fish dart off when I walk by and I spot the occasional spoonbill. I now enter an area which is wind dominated, with juvenile dunes forming everywhere and hundreds of seagulls resting in between them. I finish my journey at the tip of the Sand Motor, a steep beach with a lot of wave action. Every now and then the head of a seal pops up above the surface of the water. 

The Sand Motor is clearly starting to grow on me. It is quite special to find so many different habitats, seemingly well occupied by wildlife, right next to a dense urban area. The Sand Motor was created only 3 years ago and already a lot has happened. It will take some more years to make final conclusions about the ecological impacts of this mega-nourishment. Meanwhile I’ll enjoy the work.


Thursday, October 2, 2014

Tilting Current Meters

We have deployed a very large array of around 40 tilt meters attached to the sea floor in relatively shallow water. South African specialist Zane Thackeray and Leigh from the durban company EMS have flown in to help us out. Zane turned out to be a very dynamic character and has assisted almost everybody in their projects regarding the electronics, a true nerd amongst nerds.

Zane in Action
The tilt current meter (TCM) system consists of an autonomous logging tilt meter which is connected to the sea floor on a tile and a buoy. That means of course around 40 stones buoys and ropes in the holiday parc, in the van, in the boats and of course in the water.

Ropes, stones and buoys !
The idea is that the current determines the tilt of the device. Since the tilt meters are very economic and easy to deploy we are experimenting with an extensive array. Last Sunday the loggers have been deployed and data has been collected continuously since then. Tomorrow we plan to go trough the effort of retrieving the full array again (local fishermen will probably be happy about that).

Sunday, September 28, 2014

Most surfzone instruments are in!

The first two weeks of the experiment are almost over, and most of the instruments in the surfzone are in position.Getting instruments installed in shallow waters can be tricky, so we are glad to have these up and running now.
Instrument Plan


Instruments in the surfzone are attached to pipes that are jetted with water into the sand.
Although we have witnessed this technique at other field experiments, it's new to us to organize it ourselves.
Luckily we have had amazing help by the visiting scientists, the lifeguards of 's Gravenzande (GVRB) and Shore captain Tycho.

In the beginning of the experiment we deployed the stations close to the beach with the pump on a elevated cart (see the 'progress day 3' message below).

Pump and jetpipes ready on the beach


Some stations are on the subtidal bar, which is just to deep for our cart to reach.
The lifeguards of 's Gravenzande helped out tremendoudly with these stations. We deployed all 6 ADCP stations on the subtidal bar with the pump on their boat and ourselves standing on the sandbar and jetting next to the boat.

Ronald ready to swim out one of the NPS ACDP's

The final stations of the array are in deeper water (4-5 meter) and cannot be deployed without divers. After a bad attempt earlier this week, these stations were finally deployed yesterday.
During these deployments we have experienced the strong longshore currents in this area. It is almost impossible to swim against the tidal current, and we we're glad to have the boat nearby.

So, all 11 ADCP's are in! We added some pressure sensor sensors in between the stations to get a better view on the wave properties and CTD's to see the interaction with the fresh water from the Rhine.
Tinkering with the instruments.

With all the poles in the water, we'll keep on checking the instruments in the coming weeks and replace the batteries from time to time.


First day of the experiment. The flags mark the sightline where the instruments of the main array have to be deployed

First little storm over the weekend (day 6 &7) with instrument stations A1 & A2 near the beach
Photo of the location of array A during the calm conditions of today.


Wednesday, September 24, 2014

Drifter deployments

With part of the nearshore arrays in place, the time for GPS-tracked drifter measurements has come. Next week an extensive set of drifter deployments is planned to map the complex flow patterns at the tip (most seaward point) of the Sand Motor. Last Tuesday the Delft team performed trial deployments in order to get to know the system.


The tip of the Sand Motor is influenced by a complex mixture of strong tidal currents and wave-driven currents over a spatially highly variable bathymetry, making it quite different from the adjacent 'regular' beach. Furthermore, there might be tidal eddies forming as a result of flow separation on the northern side during flood and on the southern side during ebb currents.


The beach maintained by worms?


Tube building worms in the intertidal zone of the Sand Motor lagune.

With the wind blowing in your face and the waves roaring furiously, only few scientists observe the tiny engineers on the bottom of the sea, working hard to shape their surroundings. We find all kinds of benthic creatures at our coastline and their physical presence alone affects sediment transport. To what extent can they shape our coastal landscape? The Royal Netherlands Institute for Sea Research (NIOZ) is trying to find out. Today we started an experiment placing artificial beds of tube building worms at the Sand Motor. Over the days we will measure bed elevation under different environmental conditions.


Artificial bed of tube building worms deployed in the intertidal zone.

Sunday, September 21, 2014

Aeolian transport kicks in

After a fairly quiet period we are finally having some aeolian action. The team from TUDelft is currently measuring wind speeds and are counting the amount of sediment which is transported by wind at several locations at the Zandmotor. The sediment is counted using laser sensors at three different heights above the sand bed. If a sediment particle crosses the laser beam it is counted and the total counts per seconds are a proxi for the intensity of the sediment transport. It is expected that the intensity of the sediment transport relates to the wind speed where more wind induces larger transports. Also, the moisture content of the sediment bed is important since wet sand is more difficult to transport. Anyway, exiting data are coming in !

Sediment counting laser sensors mounted at three different heights above the sediment bed. A total of 8 measuring stations are currently installed.

Wednesday, September 17, 2014

Progress Day 3

The last two days have been full on. We all try to use these quiet days to install our measuring stations on the sea floor and in the intertidal zone. Not having high waves is making life less complicated. We have mounted 6 stations with ADCP's (horizontal and vertical) in the subtidal zone so far. Tomorrow they will try to complete the intertidal zone. At the water line the Utrecht team has installed some of their pressure sensors in the same cross shore arrays.

The TUDelft team in action jetting the pipes with the jetpump in small waves.

The Utrecht team has also set up a large array of pressure sensors in one particular cross shore array. In this array there is a more elaborated frame with instrument for more detailed flow measurements and a bottom scanner.

The 'spider' like rig of the Utrecht team in the intertidal zone.

Tuesday, September 16, 2014

MEGAPEX underway after day 1

The experiment starts with almost no wind and no waves. Utrecht university has (partly) deployed their rigs in the intertidal zone and Delft is working to get their aeolian sensors in place. Researchers have settled in their temporary accommodation. Last but not least our cabin at the beach arrived exactly on schedule !! (Thanks Tim)


We are slowly warming up our instruments and looking forward to windy and rainy weather with big waves to collect some interesting data !

The ZIRFAEA from Rijkswaterstaat was also with us installing the offshore rigs and moorings.


Friday, September 12, 2014

Welcome to the official MEGAPEX blog.

Here you can track the progress of the researchers efforts to learn as much as they can from the processes and developments at the Sand Engine mega nourishment.

Background information on the research activities can be found on the NeMo (click Megapex) and Naturecoast websites.